Dunning-Kruger and IQ: Guessed Score vs Test Score
We asked 30,075 people, before they saw their score:
Where do you think your score will land?
Score compared with people their age and country
Each dot is about 4 people (adults). The higher the dot, the better they scored compared with people their age and country. The line marks the group’s average.
MyIQtested data · Dataset 2026-09-29.1 ·
IQ test scores from 30,000+ people, grouped by where they expected their score to land before seeing it.
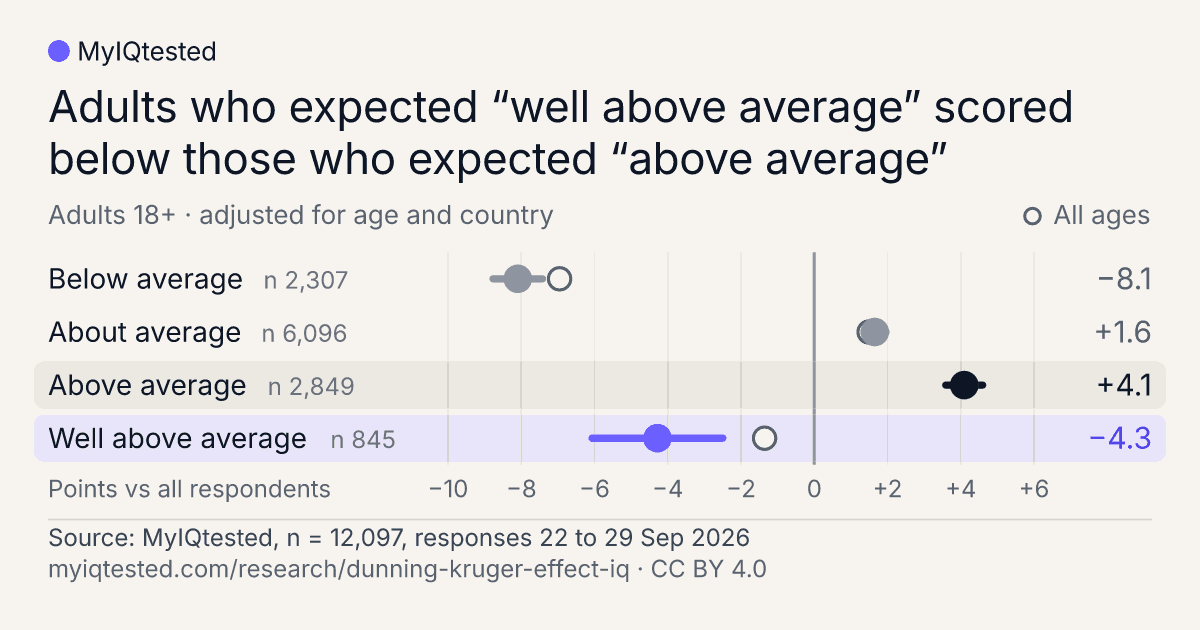
The picture above shows adults (12,097 of the 30,075 answers), adjusted for age and country, the same view Figure 1 opens on. Every figure below can show all ages.
The question
The question people were asked about their own score
Before you see it: where do you think your score will land?
- 1 Below average
- 2 About average
- 3 Above average
- 4 Well above average
Options appeared in this order, one tap to answer.
How it was asked
- 33 puzzles The full reasoning test, scored in the browser.
- Age group A single tap. It can be skipped.
- This question One question, chosen at random from those live that week. It can be skipped.
- Score revealed On the results page, after the answer.
The answer was given before the score was shown.
This is data from people who chose to take a free online test. It is not a controlled comparison, and it cannot show cause.
Fig 01 · Test score by expected score
Test scores by expected score. Points versus all respondents.
Each dot is a group’s average score as points above or below all respondents in the current filter, with its 95% confidence interval. With Adjust on, groups are compared within age band and country first.
All ages and all countries, adjusted for age and country: Below average −7.0, About average +1.5, Above average +4.1, Well above average −1.4 (points versus all respondents).
Fig 02 · Expected and actual
Do people who expect a high score get one? By actual quarter within own age band and country.
- Below average
- About average
- Above average
- Well above average
Everyone is ranked within their own age band and country and split into quarters. Each column shows the share of that quarter giving each answer.
Table view of this figure
| Quarter of own age band and country | People | Below average | About average | Above average | Well above average |
|---|---|---|---|---|---|
| Bottom quarter | 2,935 | 33.7% (32.0% to 35.4%) | 40.5% (38.8% to 42.3%) | 16.2% (14.9% to 17.6%) | 9.6% (8.6% to 10.7%) |
| Second quarter | 2,935 | 21.7% (20.2% to 23.2%) | 53.9% (52.1% to 55.7%) | 19.6% (18.2% to 21.1%) | 4.8% (4.0% to 5.6%) |
| Third quarter | 2,935 | 13.6% (12.4% to 14.8%) | 55.8% (54.0% to 57.6%) | 25.4% (23.9% to 27.0%) | 5.3% (4.5% to 6.1%) |
| Top quarter | 2,934 | 8.4% (7.5% to 9.5%) | 49.5% (47.7% to 51.3%) | 33.4% (31.7% to 35.1%) | 8.7% (7.7% to 9.8%) |
Fig 03 · Each country and age group
The same comparison in each country and age group. One shared scale.
- Below average
- About average
- Above average
- Well above average
By country 200 or more answers, current age filter, most answers first
By age group current country filter
Figure 1 for every country with 200 or more answers and every age group, on one shared scale, each with its 95% confidence interval; grey rows have fewer than 30 people. Press a panel to filter the page to it.
Table view of this figure
| Group | People | Below average | About average | Above average | Well above average |
|---|---|---|---|---|---|
| 🇮🇩 Indonesia | 6,007 | −9.2 (−10.3 to −8.2) | +2.0 (1.4 to 2.5) | +3.7 (2.9 to 4.5) | −4.6 (−6.9 to −2.2) |
| 🇯🇵 Japan | 1,657 | −5.9 (−7.0 to −4.7) | +2.0 (1.4 to 2.6) | +4.8 (3.5 to 6.1) | −6.7 (−14.1 to 0.8) |
| 🇺🇸 United States | 1,156 | −6.8 (−8.7 to −4.8) | +1.1 (0.3 to 2.0) | +4.6 (3.3 to 5.9) | −4.7 (−9.8 to 0.5) |
| 🇮🇳 India | 742 | −7.4 (−10.0 to −4.7) | −0.3 (−1.6 to 1.1) | +2.7 (1.3 to 4.1) | +2.6 (0.0 to 5.2) |
| 🇬🇧 United Kingdom | 349 | −7.7 (−10.1 to −5.4) | +1.0 (−0.3 to 2.3) | +7.8 (5.7 to 10.0) | n too small (13) |
| 🇫🇷 France | 322 | −7.9 (−11.4 to −4.3) | +0.8 (−0.4 to 2.0) | +5.2 (2.8 to 7.7) | n too small (5) |
| Under 13 | 6,140 | −7.0 (−7.8 to −6.2) | +1.4 (0.8 to 1.9) | +4.8 (3.9 to 5.7) | +5.0 (3.2 to 6.8) |
| 13 to 15 | 6,768 | −6.0 (−6.7 to −5.2) | +0.7 (0.3 to 1.1) | +4.4 (3.6 to 5.2) | +1.3 (−0.7 to 3.3) |
| 16 to 17 | 4,059 | −5.4 (−6.4 to −4.3) | +2.2 (1.7 to 2.8) | +2.2 (1.1 to 3.4) | −6.9 (−9.8 to −4.1) |
| 18 to 24 | 5,753 | −7.3 (−8.3 to −6.4) | +1.7 (1.3 to 2.1) | +3.8 (3.0 to 4.6) | −5.2 (−7.8 to −2.7) |
| 25 to 34 | 2,779 | −10.0 (−11.5 to −8.6) | +1.5 (0.9 to 2.1) | +4.3 (3.3 to 5.3) | −2.4 (−6.2 to 1.4) |
| 35 to 44 | 1,504 | −8.5 (−10.4 to −6.6) | +1.7 (0.7 to 2.6) | +3.3 (2.0 to 4.7) | −0.8 (−5.9 to 4.4) |
| 45 to 54 | 986 | −8.5 (−10.5 to −6.6) | +0.4 (−0.5 to 1.4) | +5.2 (4.0 to 6.4) | −2.5 (−7.6 to 2.7) |
| 55 to 64 | 529 | −3.5 (−6.6 to −0.3) | +0.3 (−1.2 to 1.8) | +5.4 (3.3 to 7.4) | −11.3 (−21.2 to −1.4) |
| 65 and over | 546 | −8.7 (−13.2 to −4.3) | +5.2 (2.5 to 7.8) | +5.1 (2.4 to 7.9) | −8.1 (−12.4 to −3.7) |
| Age not given | 1,011 | −6.1 (−7.9 to −4.4) | +2.8 (1.2 to 4.5) | +6.3 (4.0 to 8.6) | −3.3 (−7.0 to 0.5) |
Data table
Figure 1 as a table. For the current filter.
| Expected score | People | Share | Gap, points | 95% interval | SD of scores | d vs the rest | Median percentile | Population covered | Differs at 95% (Holm) from |
|---|---|---|---|---|---|---|---|---|---|
| Below average | 2,307 | 19.1% | −8.09 | −8.77 to −7.42 | 19.4 | −0.57 | 30th | 98% | every other group |
| About average | 6,096 | 50.4% | +1.65 | 1.34 to 1.96 | 15.3 | 0.19 | 52nd | 100% | every other group |
| Above average | 2,849 | 23.6% | +4.09 | 3.59 to 4.60 | 17.4 | 0.30 | 63rd | 98% | every other group |
| Well above average | 845 | 7.0% | −4.28 | −6.07 to −2.49 | 25.5 | −0.26 | 50th | 89% | every other group |
Gap and interval are in points versus all respondents; d is Cohen’s d against everyone else. The last column lists the groups each one differs from at 95% after correcting for the number of comparisons (Holm). No absolute score levels are published.
Methods
How the data was collected, and how every figure is computed.
01How the data was collected
Everyone took the same free online reasoning test on MyIQtested. After the last puzzle, and before the score appeared, the site showed one survey card. The order was: the 33 puzzles, the score calculated in the browser, an age card, one survey card, then the results page, where the score is first shown.
The question is chosen at random for each taker from the 4 questions live at the same time, among those their age group qualifies for. Each question stays live for 7 days, then the next question in the queue takes its place. The card can be skipped, and a row is only written when someone taps an answer or Skip: a card closed without a tap writes nothing.
This question was live from 22 Sep to 29 Sep 2026. It was shown 33,718 times and answered 30,075 times (89.2%).
02The test
The test has 33 multiple-choice puzzles, each with four options and one correct answer: 20 matrix reasoning puzzles (ICAR-based, from the International Cognitive Ability Resource framework), 6 series and logic, 4 verbal and 3 numerical. Every puzzle must be answered and there is no time limit; the median first attempt takes about 9 minutes.
The score is a fixed conversion of the number of correct answers: 51 + 3 × correct, with a floor of 55 and a ceiling of 150, so scores move in steps of 3. It is calculated in the taker’s browser and is not an empirical norm. That is why this page reports differences and ranks, never a level.
The verbal puzzles are re-authored for each language; the other 29 keep the English structure and answer key. The language versions are therefore not exactly the same instrument.
03Who answered
- Shown the question
- 33,718
- Answered
- 30,075 (89.2%)
- Skipped
- 3,643 (10.8%)
- Window
- 22 Sep to 29 Sep 2026
Age
Of the 30,075 answers, 56% came from people under 18 (including 20% under 13), 40% from adults and 3% from people who did not give an age. This question had no age limit, so under-13s were shown it.
Country
The largest groups were Indonesia (59%), United States (10%), Japan (9%), India (6%). 13 countries have their own column; the rest, 8% of answers, are pooled as Other countries.
Language
The page the question appeared on was in 12 languages; the largest were Indonesian 58%, English 30%, Japanese 8%, Russian 2%.
04Exclusions and small cells
- No row is filtered out when the figures are built: no bot, duplicate-visitor or score-range filter is applied. The same rows feed our internal report.
- Automated browsers and local development are kept out at the source: the survey is never sent from localhost, or from a browser reporting itself as automated. The answer service rejects unknown questions, answers that are not one of the options, and age-gated rows.
- Repeat takers are kept. 2,608 of 33,718 rows (7.7%) come from a visitor with an earlier row for this question, each a separate attempt. Removing them moves the group averages by between 0.3 and 0.8 points.
- People who skipped the question scored 4.8 points lower on average than people who answered it (not adjusted). Skipped cards are not in any figure except the answer-rate bars.
- Countries with fewer than 150 answers are pooled into Other countries, as are rows with no country. Age not given pools “prefer not to say”, a skipped age card and missing values.
- Cells with fewer than 5 people are pooled into Other countries before publication (141 cells, 308 people), so no cell can identify one person’s score. The aggregate CSV suppresses those cells instead.
- Any group or subgroup with fewer than 30 people is shown greyed as “n too small” and no interval is drawn.
05How the figures are computed
Every figure is relative. Nothing on this page states how high anyone or any group scored on the scale, only how groups differ from each other and where people rank among people of their own age and country.
Every range is a 95% confidence interval, and every difference we point out holds at 95% confidence after correcting for the number of comparisons (Holm method).
Strata and the standard population
A stratum is one age band within one country. Ten age bands and 14 country columns make the strata. With Adjust for age and country on, the standard population is the current filter’s own stratum mix: ws is the share of everyone in the filter who is in stratum s. With it off, everyone is pooled.
Gap versus all respondents
w̃s = ws / coverage(a), over the strata where answer a has at least one person
Adjust off: gap(a) = mean(a) − mean(everyone in the filter)
Coverage is the share of the standard population that the answer has people in; strata where nobody gave the answer are dropped and the rest re-weighted. Coverage is shown in the table when Adjust is on.
Intervals
pas = nas / ns; 95% interval = gap ± 1.96 × SE
The factor (1 − p) is there because the reference group, everyone, contains the answer. A variance estimated from fewer than 5 people is replaced by the variance of everyone in the filter. With Adjust off there is one stratum and this is the ordinary two-sample formula.
Effect size
Cohen’s d compares an answer with everyone else: d = (mean of the answer − mean of the rest) / pooled SD, using the same strata weights when Adjust is on. It is in units of the spread of scores, not in points.
Percentile within own age and country
Scores are grouped in 3-point bins and each bin is treated as a single score value. Within a stratum, everyone who shares a bin is tied and shares the range of ranks that bin covers, so the average of their percentiles is the mid-rank percentile. A person’s percentile is their rank among everyone who answered in the same age band and country, whatever they answered. Strata with fewer than 30 people are left out of the percentile figures.
The line in each hero column is the group’s average percentile, and the median in the table comes from the same distribution. With Adjust on, each answer’s distribution is the stratum-weighted average of its per-stratum distributions. The quarters in Figure 2 are cut inside each stratum, so that figure is the same with Adjust on or off.
Answer rate
Answered divided by shown, by age band, with a Wilson 95% interval.
06Limitations
- The people are volunteers who chose to take a free online test. They are not a sample of any population, and country and age mixes are those of the site’s visitors.
- Each answer is a single self-report item with four options. People may read the options differently.
- The score comes from one unsupervised sitting of a 33-puzzle test. It is not a clinical measure, and its scale is a fixed conversion, not a norm.
- 56% of answers are from people under 18, including 20% under 13, who may read the question and the test differently from adults.
- Country is recorded by the site from the visit; it may not be the person’s nationality or where they grew up.
- People who skipped the question differ from those who answered, and the answer rate for age not given (45%) shows that the group who answered is not everyone shown.
- Differences are shown with intervals, but an interval covers sampling noise only, not the ways the sample was selected.
07Versioning
- Dataset version
- 2026-09-29.1
- Generated
- 2026-09-30
- Responses
- 22 Sep to 29 Sep 2026
- Licence
- CC BY 4.0
Change log: 2026-09-29.1, first release. If the data or the method changes, the version changes and this line says what moved. Cite the version you used: myiqtested.com/research/dunning-kruger-effect-iq.
Share and cite
Everything below is free to reuse under CC BY 4.0: credit MyIQtested and link to this page. It follows the filters above.
Sharing now: Adults 18+ · adjusted for age and country · n 12,097Change filters
Share
Share this finding
A finished card and a ready message. Every link opens this page on the view you shared.
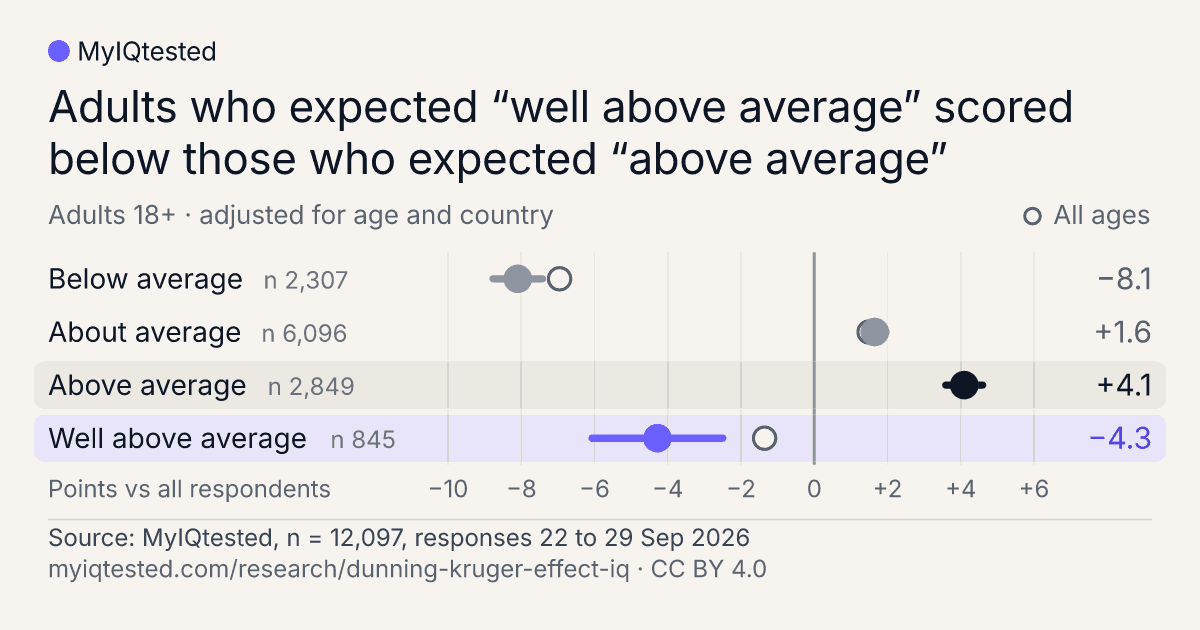
Adults 18+ · adjusted for age and country · n 12,097
Link added: myiqtested.com/research/dunning-kruger-effect-iq on this view. X, LinkedIn, Bluesky, Threads and email get a tuned version unless you edit this text.
Text for each network
- WhatsApp and default
Where do you think your IQ score will land? 30,075 people answered this after an IQ test, before seeing their score. Here is how the answers compare, by age and country:
- X
We asked 30,075 people where they expected their IQ test score to land, then compared it with how they scored. Among adults, “well above average” guessers landed below “above average” guessers. By age and country:
- Bluesky
30,075 people answered this after an IQ test, before seeing their score. Among adults, “well above average” guessers landed below “above average” guessers. By age and country:
- Threads
We asked 30,075 people where they expected their IQ test score to land, then compared it with how they scored. Among adults, “well above average” guessers landed below “above average” guessers. Filter it by age and country and see where your group sits:
- LinkedIn caption
We asked 30,075 people where they expected their IQ test score to land, then compared it with how they scored. Among adults, “well above average” guessers landed below “above average” guessers. Across all ages: “well above average” −1.4 points, “above average” +4.1 points, each versus all respondents. The data is open (CC BY 4.0) and filterable by age group and country. It describes patterns in a self-selected sample, not why they occur.
- Email
Among adults, “well above average” guessers landed below “above average” guessers We asked 30,075 people where they expected their IQ test score to land, then compared it with how they scored. Among adults, “well above average” guessers landed below “above average” guessers. Across all ages: “well above average” −1.4 points, “above average” +4.1 points, each versus all respondents. It describes patterns in a self-selected online sample, not why they occur. The data is free to reuse under CC BY 4.0.
Cite
Cite this data set
Version 2026-09-29.1. Citing the version lets readers find the exact numbers.
MyIQtested. (2026). Dunning-Kruger and IQ: Guessed score vs test score (Version 2026-09-29.1) [Data set]. https://www.myiqtested.com/research/dunning-kruger-effect-iq@misc{myiqtested2026dunningkrugera,
author = {{MyIQtested}},
title = {Dunning-Kruger and IQ: Guessed score vs test score},
year = {2026},
version = {2026-09-29.1},
publisher = {MyIQtested},
howpublished = {Data set},
url = {https://www.myiqtested.com/research/dunning-kruger-effect-iq},
note = {Licence CC BY 4.0}
}MyIQtested (2026). Dunning-Kruger and IQ: Guessed score vs test score. Data set, version 2026-09-29.1. https://www.myiqtested.com/research/dunning-kruger-effect-iq (CC BY 4.0)Credit MyIQtested and link to this page.Licence text