
An IQ score chart can feel like a strange little weather map for the mind: 100 in the centre, 115 one step above, 85 one step below. The danger is treating the number as a verdict. Better to read it as a position on a normed scale, with percentiles, bands and error around it. A score can orient you. It shouldn’t shrink the story of a person.
IQ score chart: every band, percentile and population share
Most modern IQ score charts use a WAIS-IV-style scale: an average of 100 and a standard deviation of 15. On that scale, 115 is one standard deviation above the centre, 85 is one below, and 130 is two above. Mensa describes IQ as a standard score showing distance from a peer group whose average is set at 100.4
This page is the lookup chart. If you want a score-by-score reading from 70 to 150, use our per-score interpretation guide. Here, the job is different: the full IQ scale, band labels, percentile ranks, population share, test-to-test conversions, and the error band around a single result.
An IQ score describes performance on cognitive tasks under test conditions. It doesn’t describe a whole person.
The IQ classification table
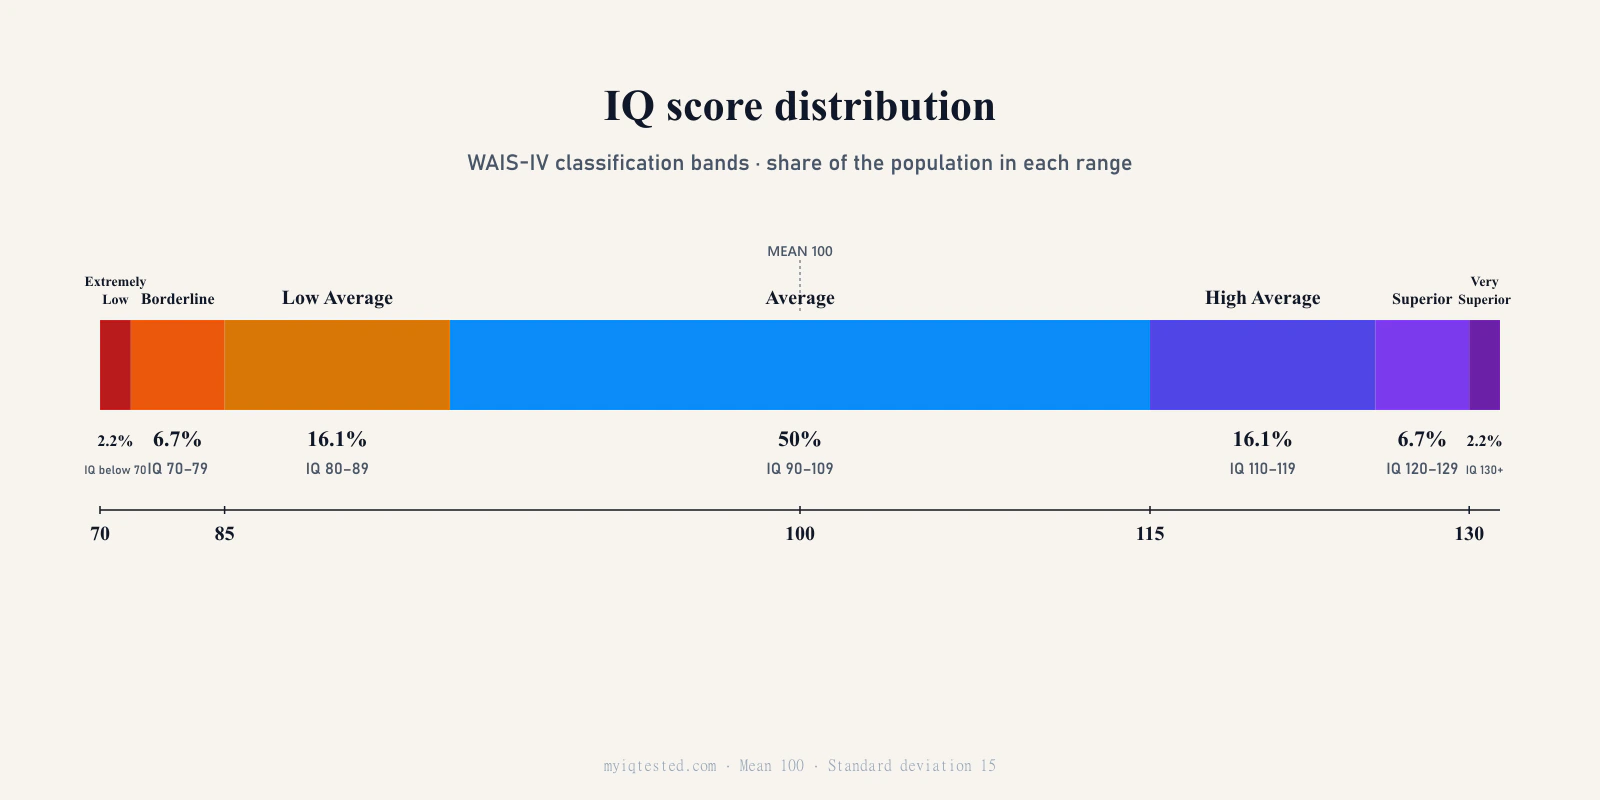
The classification table below uses the familiar seven-band Wechsler layout: Extremely Low, Borderline, Low Average, Average, High Average, Superior, and Very Superior. Pearson’s WAIS-IV materials identify the Administration and Scoring Manual and the Technical and Interpretive Manual as the scoring sources for the test, which is why these band names are the usual starting point for a Wechsler-style chart.1
Read the embedded infographic from left to right. First comes the score range. Then comes the band label, the percentile range, and the share of people expected to fall there if scores follow the normal IQ distribution. The shares are rounded. Real norm samples are human, not geometry, so they never sit perfectly on the ideal curve.
| IQ score range | Classification | Percentile position | Population share | Plain-language reading |
|---|---|---|---|---|
| Under 70 | Extremely Low | Below about 2nd | About 2.2% | Very low performance on this kind of cognitive test. |
| 70-79 | Borderline | About 2nd-9th | About 6.7% | Below the usual range, and best read with context. |
| 80-89 | Low Average | About 9th-25th | About 16.1% | Below the centre, but common in the population. |
| 90-109 | Average | About 25th-75th | About 50.0% | The broad middle of the bell curve. |
| 110-119 | High Average | About 75th-91st | About 16.1% | Above average; IQ 110 sits here. |
| 120-129 | Superior | About 91st-98th | About 6.7% | High performance; IQ 120 is roughly the 91st percentile. |
| 130+ | Very Superior | About 98th and above | About 2.2% | Very rare performance, roughly the top 2%. |
A score of 130 is often called “gifted” in school or society settings, but the Wechsler-style table calls the band Very Superior. That difference matters. The label is a statistical address, not a personality type, not a future written in ink, and not a certificate of worth.
If you remember one row, remember the middle one: 90-109 contains about half of people. Average isn’t a pin on the chart. It’s a wide, busy street.
Reading percentiles on the chart
A percentile means the share of the norm sample scoring at or below a score. If your result is at the 84th percentile, you scored as high as or higher than about 84 out of 100 people in the comparison group. The University at Albany psychology statistics table gives the normal-curve areas behind these conversions: z = 0 is the 50th percentile, z = 1 is about the 84th, z = 2 is about the 98th, and z = 3 is about the 99.87th.8
On the SD-15 IQ scale, the arithmetic is simple: subtract 100, then divide by 15. The answer is the z-score, or how many standard deviations the score sits from the mean.
| IQ | z-score | Percentile | Rarity above this score |
|---|---|---|---|
| 100 | 0.00 | 50th | 1 in 2 score higher |
| 110 | 0.67 | 75th | About 1 in 4 score higher |
| 115 | 1.00 | 84th | About 1 in 6 score higher |
| 120 | 1.33 | 91st | About 1 in 11 score higher |
| 125 | 1.67 | 95th | About 1 in 21 score higher |
| 130 | 2.00 | 97.7th, often rounded to 98th | About 1 in 44, often said as 1 in 50 |
| 140 | 2.67 | 99.6th | About 1 in 260 |
| 145 | 3.00 | 99.87th | About 1 in 740 |
Percentiles get rare faster than the eye expects. The move from 100 to 115 is the kind of difference you meet often in ordinary life: classrooms, offices, families, train carriages. The move from 130 to 145 is also 15 IQ points, but it happens out in the thin tail of the curve. The same distance on the score scale doesn’t feel like the same distance in the population.
A percentile is a rank in a norm table. It isn’t a rank in human value.
The IQ bell curve
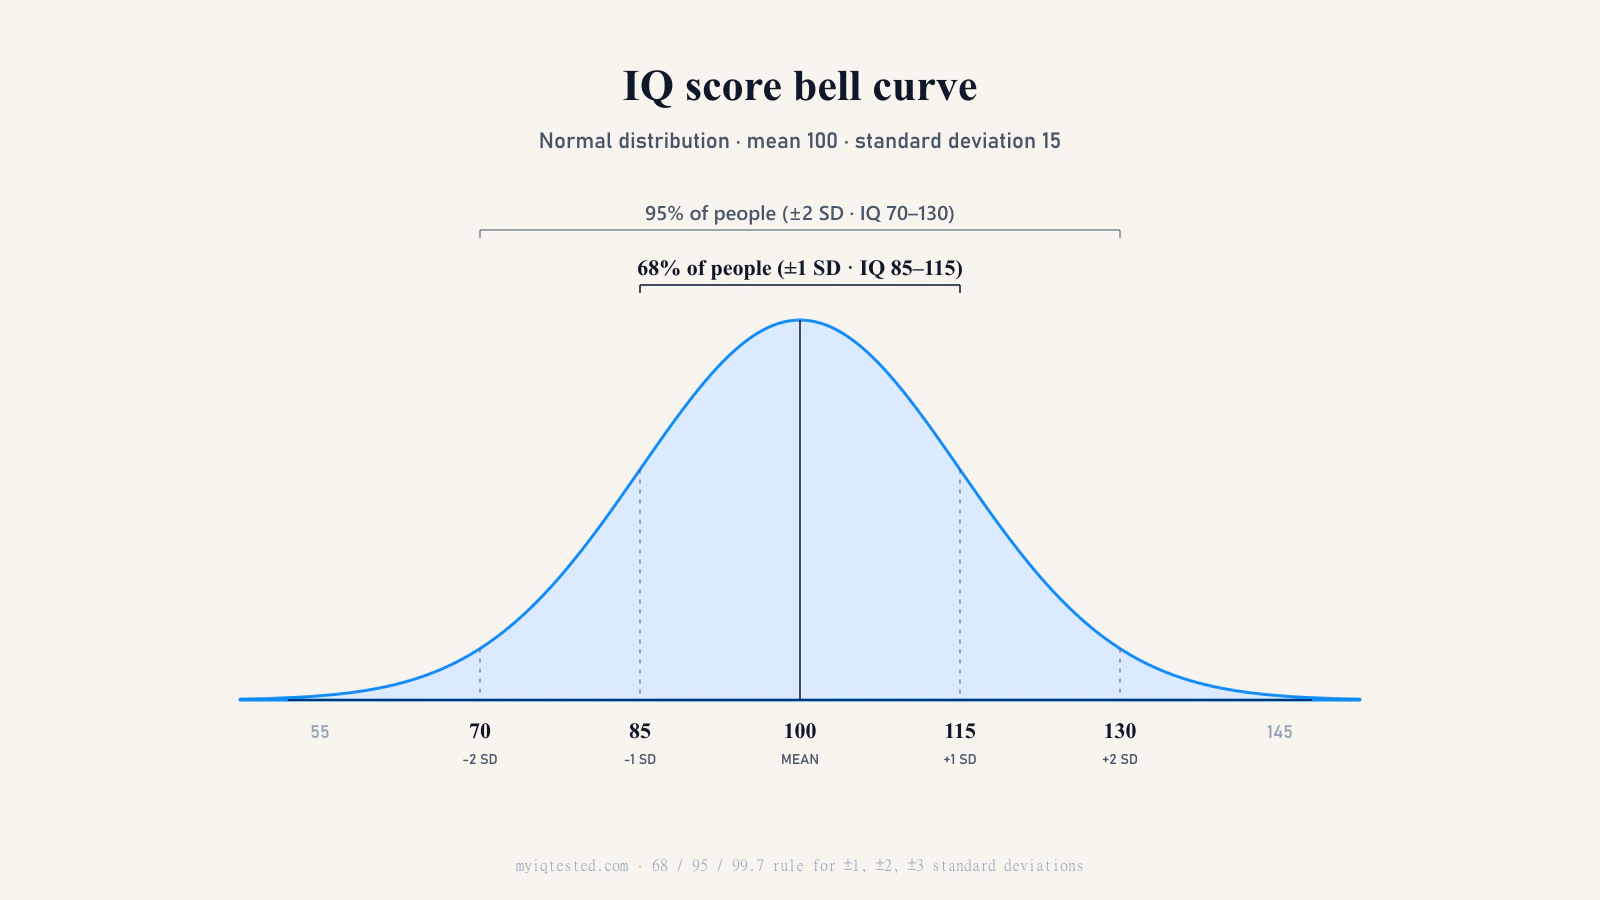
The IQ bell curve is the picture behind the table. Scores cluster near 100 and thin out toward both tails. In the embedded bell-curve infographic, the shaded area to the left of a score is the percentile. For IQ 115, the shaded area is about 84%. For IQ 130, it’s about 98%. For IQ 70, it’s about 2%, using the same standard normal logic as the percentile table.8
The chart is symmetric because the scale is centred on a mean, with equal standard-deviation steps above and below that centre. One step up from 100 is 115. One step down is 85. Two steps up is 130. Two steps down is 70. The high side and low side mirror each other mathematically, even though the lived meanings of low and high scores can feel very different.
IQ:       55      70      85      100      115      130      145
SD:       -3      -2      -1        0       +1       +2       +3
Share:             68% fall between 85 and 115
                  95% fall between 70 and 130
                99.7% fall between 55 and 145
The 68 / 95 / 99.7 rule says that about 68% of scores fall within one standard deviation of the mean, about 95% within two, and about 99.7% within three. For IQ, that means roughly 85-115, 70-130, and 55-145.
The tails matter because people ask many anxious questions there: “Is 130 rare?” “What percentile is 140?” “What is the highest IQ band?” The answer is statistical, not mystical. A 140 sits around the 99.6th percentile, while the highest Wechsler-style band remains Very Superior, beginning at 130.
Tail scores also carry wider error. There are fewer norm cases and fewer test items that separate people cleanly at the extremes, so the chart gets less sharp there. A tail score is still a day’s performance on selected tasks, not a specimen under glass.
Wechsler vs Stanford-Binet vs Cattell — same percentile, different number
Here is the small trap in IQ charts: the number doesn’t mean much until you know the test and its standard deviation.
IQ = 100 + (z × test standard deviation)
Wechsler tests use a mean of 100 and an SD of 15, and Pearson’s WAIS-IV materials are the usual reference point for that scoring frame.1 Stanford-Binet 5 also reports composite scores with a mean of 100 and an SD of 15; the PAR publisher page describes the SB5, and the Riverside / HMH assessment bulletin states the same 100-and-15 composite-score scale.23
Older Stanford-Binet scoring often used SD = 16. Cattell III B, as used in Mensa contexts, used SD = 24. That’s why Mensa International can describe a top-2% qualifying result as 132 or more on Stanford-Binet or 148 or more on the Cattell equivalent.4 Mensa’s FAQ puts the same idea plainly: 132 on one test can equal 148 on another.5
| Meaning | z-score | Wechsler / SB5 SD 15 | Older Stanford-Binet SD 16 | Cattell III B SD 24 | Percentile |
|---|---|---|---|---|---|
| Average | 0.00 | 100 | 100 | 100 | 50th |
| One SD above average | +1.00 | 115 | 116 | 124 | 84th |
| High range | +1.33 | 120 | 121 | 132 | 91st |
| Mensa-style cutoff | +2.00 | 130 | 132 | 148 | About 98th |
| Very rare | +2.67 | 140 | 143 | 164 | 99.6th |
| Three SDs above average | +3.00 | 145 | 148 | 172 | 99.87th |
American Mensa’s qualifying-score list gives the same practical crosswalk: Stanford-Binet 5 at 130, Wechsler Full Scale IQ at 130, Stanford-Binet at 132, and Cattell at 148.6 An American Mensa explainer also states that Cattell IIIB used a mean of 100 and SD of 24, so 148 represented the same top-tail threshold as the Stanford-Binet number on its own scale.7
Same percentile. Different surface number. This is why an old report saying “148” might not mean what a new Wechsler-style chart makes you feel it means.
Read every score as a band, not a point
A single IQ score has measurement error. Pearson’s WAIS-IV technical update uses standard errors of measurement when comparing composite scores, which is the formal version of a truth test users often feel instinctively: one sitting can’t catch a mind with perfect stillness.11
For everyday reading, treat a one-sitting Wechsler score as roughly plus or minus five points. The SEM for many composite scores sits around 2.4-3.5 points, but a 95% confidence interval is wider than the SEM itself. That’s the range people see in reports and the range worth keeping in mind.
So an IQ of 120 is better imagined as about 115-125. An IQ of 130 is better imagined as “around the Very Superior cutoff”, not as a knife-edge separating two kinds of mind.
Retesting can move scores as well. A meta-analysis of cognitive-ability retesting found gains from repeated exposure, especially over the first few administrations.10 Sleep, anxiety, illness, rapport with the examiner, speeded tasks, and prior practice all matter.
The kindest reading is also the most scientific one: use the number as a band of evidence.

What the chart does not show
The chart shows statistical position. It doesn’t show human value.
It says nothing direct about conscientiousness, persistence, creativity, humour, courage, social skill, taste, patience, or opportunity. It won’t tell you who will be a loyal friend, a careful nurse, a good parent, a wise manager, or a generous neighbour. It measures performance on selected cognitive tasks: reasoning, working memory, processing speed, verbal knowledge, or spatial problem solving.
The chart also doesn’t show your subscale profile. Two people can both have a Full Scale IQ of 115 while one is stronger verbally and the other is stronger visually. WAIS-IV research describes the test as built from core subtests that feed a Full Scale IQ and index scores, which is why the profile can matter as much as the headline score.12
And the chart moves through history. The Flynn Effect describes rising IQ test performance across generations; a large meta-analysis found broad gains across the twentieth century, with the rate varying by domain and slowing in more recent decades.9 That’s one reason tests are re-normed. A 1995 score and a 2025 score may share the same number while resting on different norm samples.
The number is useful. It isn’t sacred.
How to use this chart
Use the chart as a map, not a mirror.
- Find the score range. If your score is 115, you’re in High Average. If it’s 120, you’re in Superior. If it’s 130, you’re at the Very Superior boundary.
- Read the percentile. IQ 100 is the 50th percentile. IQ 115 is about the 84th. IQ 130 is often rounded to the 98th. IQ 145 is about the 99.87th.
- Check the test. Wechsler and SB5 numbers use SD 15. Older Stanford-Binet and Cattell scales can use different SDs, so don’t compare surface numbers without converting them.
- Treat the score as a band. A 120 report doesn’t mean “exactly 120 forever”. Think 115-125 unless the report gives a tighter confidence interval.
For individual meanings, read the score-by-score interpretation guide. For the top-2% admission line, read about the Mensa qualifying threshold. For the mechanics behind the scale, see how IQ tests are scored and normed. If your number came from the web, read how online tests compare with supervised ones before you attach too much weight to it.
The point of a chart is orientation. It should make you calmer, not smaller.